
frame
Howdy, Stranger!
It looks like you're new here. If you want to get involved, click one of these buttons!
Sign In RegisterHowdy, Stranger!
It looks like you're new here. If you want to get involved, click one of these buttons!
Quick Links
Categories
- 1.4K All Categories
- 7.3K General
- 6.2K General Discussions
- 412 Feature Request/Bug Report
- 545 Sales Questions and Answers
- 54 Time4VPS Life
- 242 Help requests
- 244 Server management
- 390 Tutorials
- 68 Various Tutorials
- 71 Web hosting control panels
- 133 Performance and Security
- 29 Web Applications
- 64 Linux Applications
- 25 Windows VPS


How to install Sysstat/SAR
 Michail
Moderator
Michail
Moderator
Introduction
Sysstat is a versatile utility for monitoring and analyzing system performance. It provides detailed insights into various performance metrics, helping users identify potential bottlenecks and optimize system resources effectively.
In this guide we will install sysstat on Ubuntu/Debian and AlmaLinux/RockyLinux 9.
Installation and Use Guide
1. Update the system
On Ubuntu/Debian, run the following command:
apt update && apt upgrade -y
On RedHat-based distributions, run this command to update the system:
dnf update && dnf upgrade -y
2. Install Sysstat
To install Sysstat, run the following command on Ubuntu/Debian
apt install sysstat -y
On RedHat distributions, run this command:
dnf install sysstat -y
3. Start sysstat
Run these commands to start and enable sysstat:
systemctl start sysstat
systemctl enable sysstat
4. Enable data collection (Ubuntu/Debian)
On Ubuntu and Debian, you need to enable data collection. To do this, navigate to the configurations file and edit it. Open the configurations file with your preferred text editor (in this example we are using vi):
vi /etc/default/sysstat
Then, find this line:
ENABLED="false"
Change "false" to "true".
Save the file and exit (press "Esc", then type :wq and click "Enter").
After that restart sysstat:
systemctl restart sysstat
5. Verify installation
Verify installation and check the installed sysstat version by running this command:
sar -V
You also can check the status of the sysstat:
systemctl status sysstat
6. Run sysstat
You can now use tools like iostat, mpstat, pidstat, sar.
Command iostat provides Input/Output statistics:
iostat
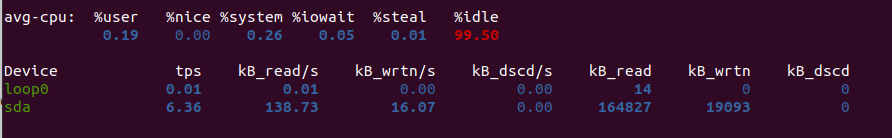
iostat output includes:
CPU Metrics (avg-cpu):
%user: Time the CPU spends executing user processes.
%system: Time spent on system-level (kernel) operations.
%iowait: Time the CPU waits for I/O operations to complete.
%idle: Time the CPU remains idle, indicating there is unused capacity.
The CPU usage in this example is relatively low, with most time spent idle, while a small percentage is used by user processes (%user).
Disk Metrics:
Devices (loop0, sda):
- loop0: A virtual device with negligible activity.
sda: The main storage device.
tps: Transactions per second on the sda device.
kB_read/s: Read rate from the disk (kilobytes per second).
kB_wrtn/s: Write rate to the disk (kilobytes per second).
kB_read: Total kilobytes read since boot.
kB_wrtn: Total kilobytes written since boot.
mpstat displays CPU usage statistics, either for all CPUs or per individual CPU core:

CPU Metrics:
- %usr: Percentage of CPU time used for user-level processes.
- %sys: Percentage of CPU time used by the kernel for system processes.
- %iowait: Time the CPU spends waiting for I/O operations to complete.
- %idle: Idle time, indicating unused CPU capacity.
- %steal: Time stolen by hypervisor for other virtual machines (on virtualized systems).
Other fields such as %nice, %irq, and %soft indicate time spent on specific tasks (e.g., handling interrupts), which are negligible in this example.
The CPU column displays "all" to show aggregate statistics across all CPUs. If individual CPU data is needed, you can use:
mpstat -P ALL

pidstat reports statistics for individual processes, including CPU, memory, and I/O usage:
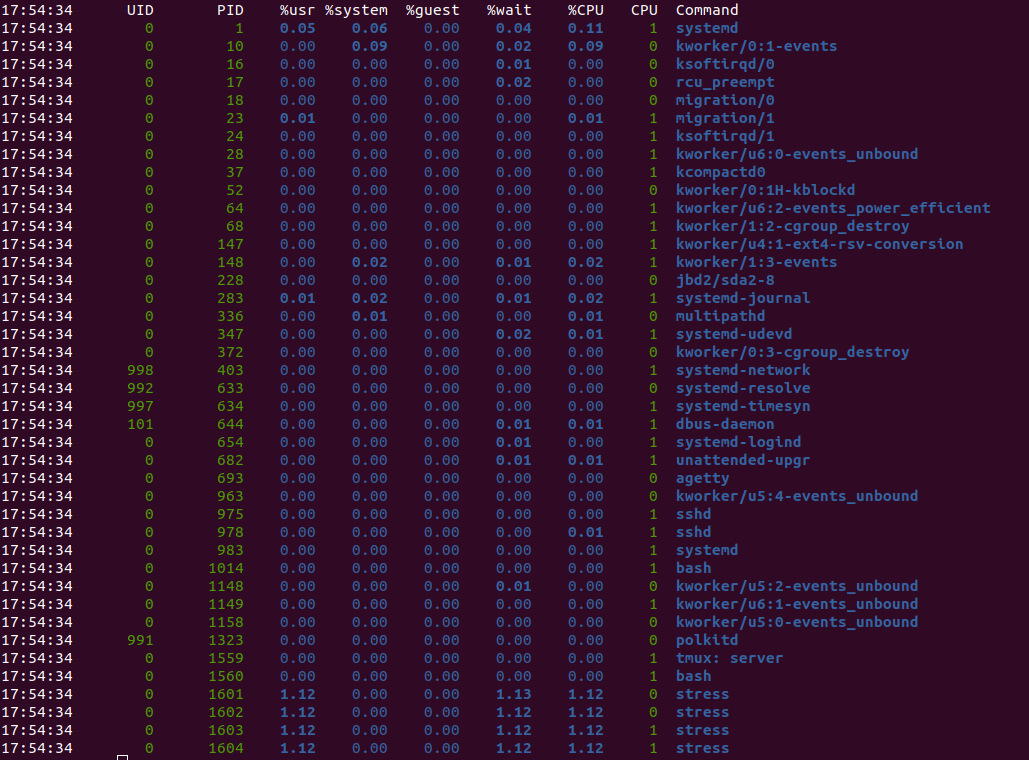
Key Columns:
- UID: The user ID of the process owner. For example, 0 indicates the root user.
- PID: The process ID.
- %usr: Percentage of CPU time spent in user space by the process.
- %system: Percentage of CPU time spent in kernel space (system processes).
- %wait: Percentage of time the process spent waiting for I/O operations.
- %CPU: Combined percentage of CPU utilization by the process.
- CPU: The specific CPU core handling the process.
sar collects, reports, and saves system activity statistics over time:
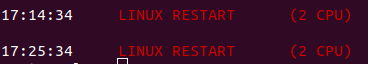
The sar command is often used to:
- Gather historical performance data after a reboot.
- Track system usage patterns over time for analysis.
6. General Help for sysstat Commands
Most sysstat tools come with a built-in help option (-h or --help). For example:
iostat --help
You can run each sysstat command with this option to see detailed information.
Conclusion
In this guide, we've explored how to use the ssystat command to monitor the performance and health of your system. ssystat is a powerful tool that provides real-time statistics on various system resources, such as CPU usage, memory usage, disk I/O, and network activity, which can help you identify performance bottlenecks and optimize your system's overall efficiency.
By regularly monitoring the outputs of ssystat, you can stay up-to-date on your system's status and take proactive steps to resolve potential issues before they escalate.
foot
Feel free to join our constantly expanding community, participate in discussions, strengthen your knowledge on Linux and Windows server management!
© 2013 - 2025 Time4VPS. All rights reserved.