
frame
Howdy, Stranger!
It looks like you're new here. If you want to get involved, click one of these buttons!
Sign In RegisterHowdy, Stranger!
It looks like you're new here. If you want to get involved, click one of these buttons!
Quick Links
Categories
- 1.4K All Categories
- 7.3K General
- 6.2K General Discussions
- 412 Feature Request/Bug Report
- 545 Sales Questions and Answers
- 54 Time4VPS Life
- 242 Help requests
- 244 Server management
- 390 Tutorials
- 68 Various Tutorials
- 71 Web hosting control panels
- 133 Performance and Security
- 29 Web Applications
- 64 Linux Applications
- 25 Windows VPS


How to check your VPS resource usage?
 Ievaz
Administrator
Ievaz
Administrator
It is crucial to monitor VPS resource usage because it might affect your VPS performance when resource limits are exceeded.
Due to various reasons (incorrect VPS configuration, lack of resources, etc.), VPS resource limits might be reached. It might slow a server; the server might not be accessible; some services might not start running; etc.
So in this tutorial, I will show how to check your virtual private server (VPS) resource usage.
Resource Usage Graphs
Via client area, you can check your VPS resource usage graphs (daily, weekly, monthly and annual).
Those graphs can be review by navigating to your VPS management page and clicking on 'Server Usage Graphs.'

Here is a guide that explains the graphs in detail.
Also, via the client area, you can see your VPS RAM, storage, and bandwidth usage. However, the usage results are not real-time.
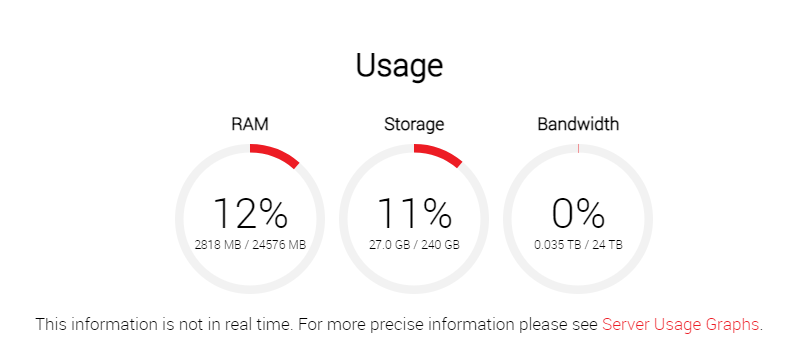
So it would be better to check your VPS resource usage inside your server by connecting to your VPS directly.
Checking Resource Usage via SSH
Via SSH, you can check your VPS real-time resource usage. Here are provided most useful commands:
top
The top (or htop) command supports real-time monitoring of server resource usage and continuously updates resource usage results.
This command displays the currently active processes, the % of the CPU they are using, RAM usage and so on.
The output will look like following:
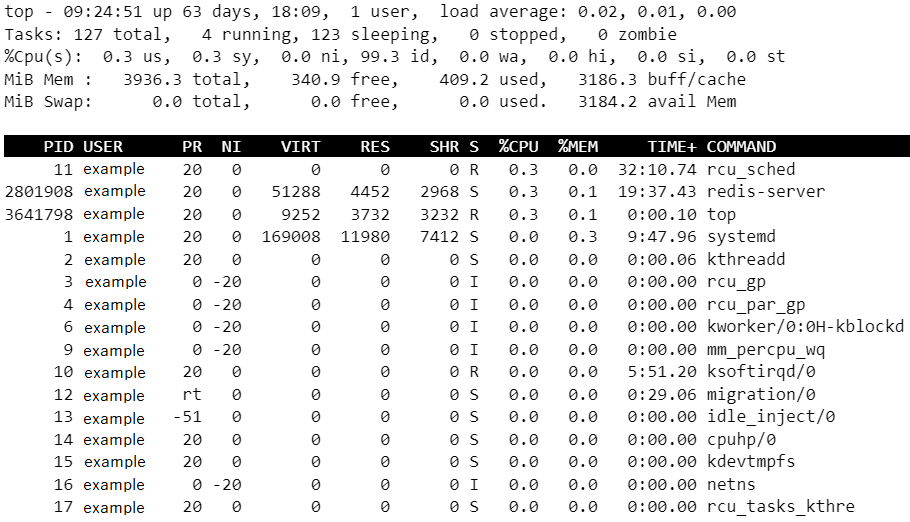
The command results show on five lines, plus the main table.
Line 1 - shows info about the system:
* the time;
* how long the server has been running;
* number of users;
* load average shows the system load time for the last 1, 5, and 15 minutes.
Line 2 - summarizes the number of ongoing tasks:
* total number of tasks;
* number of running tasks;
* number of sleeping tasks;
* number of stopped tasks;
* number of zombie tasks.
Line 3 - summarizes CPU usage as a percentage:
* by the user (us);
* by system (sy);
* by low priority processes (ni);
* by idle processes (id);
* by io wait (wa);
* by hardware interrupts (hi);
* by software interrupts (si);
* by steal time (st).
Line 4 - shows the total amount (in kibibytes) of physical memory. Also, it shows how much is free, used, and buffered/cached.
Line 5 - shows the total amount (in kibibytes) of swap memory. Also, it shows how much is free, used, and available.
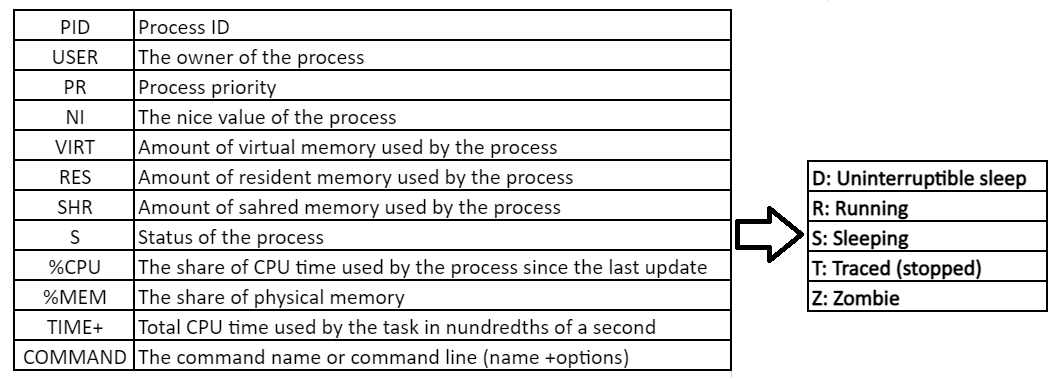
Main Table - provides the list of running processes:
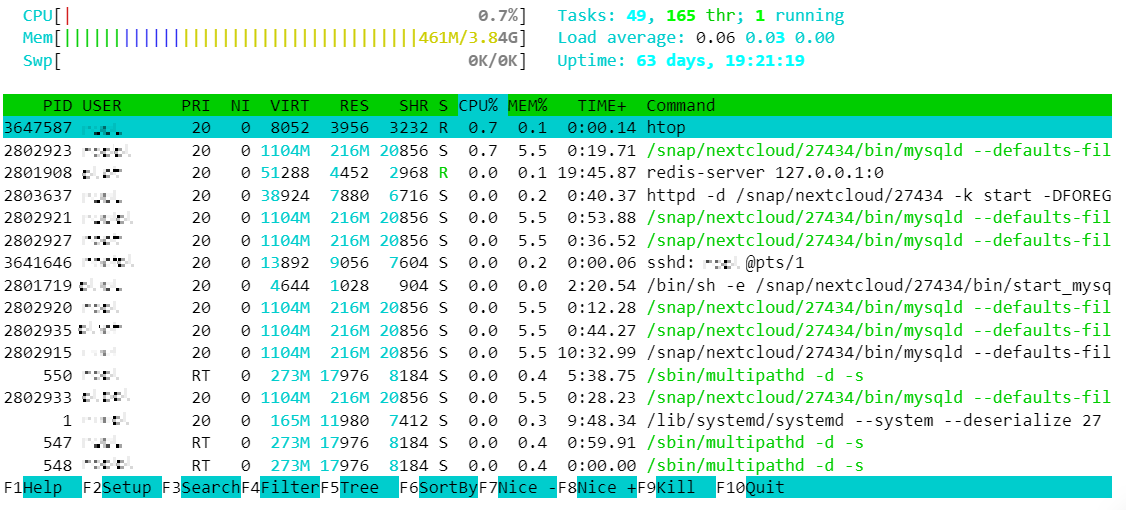
htop
This command might no be installed on most distributions by default, but htop works similarly as top command. However, htop shows all running processes whereas top command focuses on the top processes that consume the most system resources.
The output will look like following:
Those commands will display general VPS resource usage results. However, there are more useful commands that you can use for checking different resource usages. We have prepared another article that explains how to view memory (RAM) usage of your VPS via SSH.
It is essential that your VPS would run at an optimal level and a few simple terminal commands can help you access all relevant information. This provided information will help you monitor your VPS usage and detect a problem if VPS resource usage limits will be exceeded.
foot
Feel free to join our constantly expanding community, participate in discussions, strengthen your knowledge on Linux and Windows server management!
© 2013 - 2025 Time4VPS. All rights reserved.