
frame
Howdy, Stranger!
It looks like you're new here. If you want to get involved, click one of these buttons!
Sign In RegisterHowdy, Stranger!
It looks like you're new here. If you want to get involved, click one of these buttons!
Quick Links
Categories
- 1.4K All Categories
- 7.3K General
- 6.2K General Discussions
- 412 Feature Request/Bug Report
- 545 Sales Questions and Answers
- 54 Time4VPS Life
- 242 Help requests
- 244 Server management
- 390 Tutorials
- 68 Various Tutorials
- 71 Web hosting control panels
- 133 Performance and Security
- 29 Web Applications
- 64 Linux Applications
- 25 Windows VPS


Overview of server graphs
 Justina
Moderator
Justina
Moderator
In your client area, you have the ability to view your server graphs. They provide daily, weekly, monthly and annual data. The following graphs are provided:
Traffic
Netpps (network packets per second)
CPU

In the daily schedule, the maximum value of the 5-minute average of the load condition is 5.13. Given that the server has 28.8 GHz (i.e., 12 CPU x 2.6 GHz), the server load condition is stable at a minimum.
Example of a weekly graph:

In the weekly chart, the maximum value of the 5-minute value of the load is 5.71.
I/O
IOPS
Memory

Storage
 In the weekly schedule we can see how disk storage usage increased during the week.
- Traffic
- Netpps
- CPU
- Load
- I/O
- IOPS
- Memory
- Storage
- "Current" - the current (last) value recorded in the graph;
- "Average" - the average value of the data in the graph;
- "Maximum" - the maximum recorded value.
Traffic
This chart provides information about traffic to and from the server.
Example of a daily graph:

The maximum daily outgoing traffic value is 4.68 Mbit/s and the maximum incoming traffic value is 44.97 Mbit/s.
Example of a weekly graph:

In this case, the maximum monthly value of the outgoing traffic is 5.96 Mbit/s and the highest incoming traffic value is 58.35 Mbit/s.
- Incoming Taffic;
- Outgoing Traffic.
Example of a daily graph:
The maximum daily outgoing traffic value is 4.68 Mbit/s and the maximum incoming traffic value is 44.97 Mbit/s.
Example of a weekly graph:
In this case, the maximum monthly value of the outgoing traffic is 5.96 Mbit/s and the highest incoming traffic value is 58.35 Mbit/s.
Netpps (network packets per second)
This chart shows the number of packets traveling to/from the server.
Example of a daily graph:

This chart recorded a maximum value of 21633.45 p/s of outgoing packets per second, and the maximum value of incoming packets was 9856.33 p/s.
Example of a weekly graph:
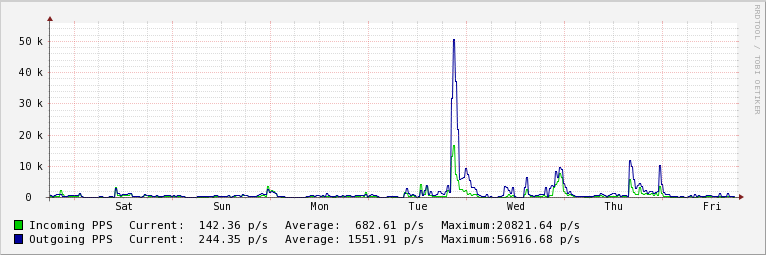
In the weekly schedule, the maximum recorded value of packets per second was 56916.86 p/s, and the maximum recorded value of incoming packets per second was 20821.54 p/s.
- Incoming PPS - Incoming packets per second;
- Outgoing PPS - Outgoing packets per second.
Example of a daily graph:
This chart recorded a maximum value of 21633.45 p/s of outgoing packets per second, and the maximum value of incoming packets was 9856.33 p/s.
Example of a weekly graph:
In the weekly schedule, the maximum recorded value of packets per second was 56916.86 p/s, and the maximum recorded value of incoming packets per second was 20821.54 p/s.
CPU
This graph shows the percentage of server CPU load.

Based on the information in the chart, we see that the server is dominated by low-priority processes. The maximum CPU time spent by the processor in these processes was 19.68%. Systemic processes follow, with a maximum CPU time of 12.24%, and finally we see system user processes (6.18%).
Example of a weekly graph:

Systematic user processes dominate the weekly schedule - 24.92%, followed by low-priority processes - 22.10% and finally systematic processes - 11.75%.
- User CPU - Processor time that processor spends while running system-initiated user processes (PHP, Apache, MySQL);
- Nice CPU - Processor time spent by processor in performing low priority processes;
- System CPU - Processor time that the processor spends while performing system initiated processes;
- Iowait CPU - Processor time spent by the processor while waiting for completion of input/output operations;
- Idle CPU - Is the time the processor spends without any work.
Based on the information in the chart, we see that the server is dominated by low-priority processes. The maximum CPU time spent by the processor in these processes was 19.68%. Systemic processes follow, with a maximum CPU time of 12.24%, and finally we see system user processes (6.18%).
Example of a weekly graph:
Systematic user processes dominate the weekly schedule - 24.92%, followed by low-priority processes - 22.10% and finally systematic processes - 11.75%.
Load
This graph shows the CPU Load Indicator, i.e. the load condition.- Load Average, 5 min. - Average value of the load 5 min;
- Load Average, 1 min. - Average value of the load 1 min.
In the daily schedule, the maximum value of the 5-minute average of the load condition is 5.13. Given that the server has 28.8 GHz (i.e., 12 CPU x 2.6 GHz), the server load condition is stable at a minimum.
Example of a weekly graph:
In the weekly chart, the maximum value of the 5-minute value of the load is 5.71.
You can find more information about the CPU load indicator here.
I/O
The I/O graph provides the expressions of the disk read/write operations performed by the server disk subsystem. Disc reading and writing is presented in "B/s, "kB/s", "MB/s".

On this server, the maximum disk write value is recorded at 845.98 kB/s in the daily graph and the maximum reading value is recorded at 631.18 kB/s.
Example of a weekly graph:

Meanwhile, the weekly chart shows a maximum disk write value of 1.34 MB/s and a read value of 1.24 MB/s.
- Read I/O - Disk read operations;
- Write I/O - Disk writing operations.
On this server, the maximum disk write value is recorded at 845.98 kB/s in the daily graph and the maximum reading value is recorded at 631.18 kB/s.
Example of a weekly graph:
Meanwhile, the weekly chart shows a maximum disk write value of 1.34 MB/s and a read value of 1.24 MB/s.
IOPS
This chart shows disk read and write operations per second.
Example of a daily graph:

As we can see in this example, the maximum recorded value of disk write operations per second was 166.87 io/s, and the maximum value of disk read operations per second was 19.71 io/s.
Example of a weekly graph:

In the weekly chart, the maximum value of disk writing operations per second was 178.85 io/s, while the value of dictation readings per second was 394.42 io/s.
- Read IOPS - disk read operations per second;
- Write IOPS - Drive writing operations per second.
Example of a daily graph:
As we can see in this example, the maximum recorded value of disk write operations per second was 166.87 io/s, and the maximum value of disk read operations per second was 19.71 io/s.
Example of a weekly graph:
In the weekly chart, the maximum value of disk writing operations per second was 178.85 io/s, while the value of dictation readings per second was 394.42 io/s.
Memory
This graph shows the server's RAM.
In this chart legend contains:
Example of a daily graph:

In this chart legend contains:
- Used Memory - used memory;
- Active Memory - memory in use;
- Active Swap - busy Swap memory.
Example of a daily graph:
In this graph, the current 'Used memory' (Current) is 3.03 GB, the 'Active memory' is 1.71 GB. The size of occupied 'Active Swap' is 0.00 B.
Example of a weekly graph:
In weekly graph maximum value of 'Used Memory' was 7.99 GB and the maximum value of 'Active Memory' was 4.81 GB.
For more detailed information on RAM, see check out this page.
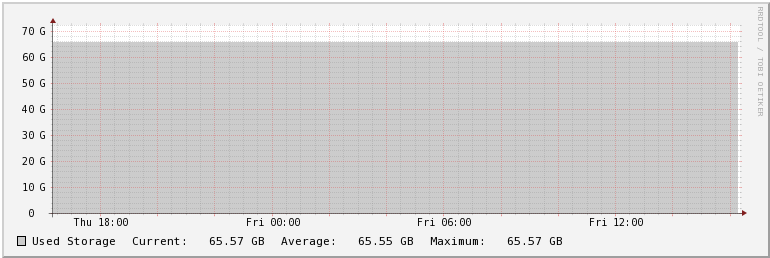
Storage
This graph shows the usage of the server disk space.
In this chart legend contains:
- Used Storage - the disk space used.
Example of a daily graph:
As we can see, currently there is 65.57 GB of used storage on the server.
Example of a weekly graph:
Tagged:
foot
Feel free to join our constantly expanding community, participate in discussions, strengthen your knowledge on Linux and Windows server management!
© 2013 - 2025 Time4VPS. All rights reserved.